Reversal candlestick patterns are a common technical analysis tool that reflects the shift between supply and demand in the stock market. By analyzing the shape of individual candlesticks, investors can assess trading sentiment and identify early signs of a market reversal, enabling them to make more informed buying and selling decisions.
There are two main types of reversal patterns: bullish reversal patterns, which appear after a downtrend and signal a potential recovery; and bearish reversal patterns, which appear after an uptrend and warn of a potential correction.
Here are 6 basic, easily recognizable, and reliable reversal candlestick patterns for investors:
Hammer - a clear sign of bottoming
The hammer candlestick pattern typically appears after a period of decline, signaling a potential recovery. It's characterized by a small body, a lower shadow 2-3 times longer than the body, and a short or absent upper shadow. This suggests initial strong selling pressure, but buyers returned, pushing the closing price back up near the opening price.
Investors may consider buying if a strong green candle follows the hammer, accompanied by high trading volume.
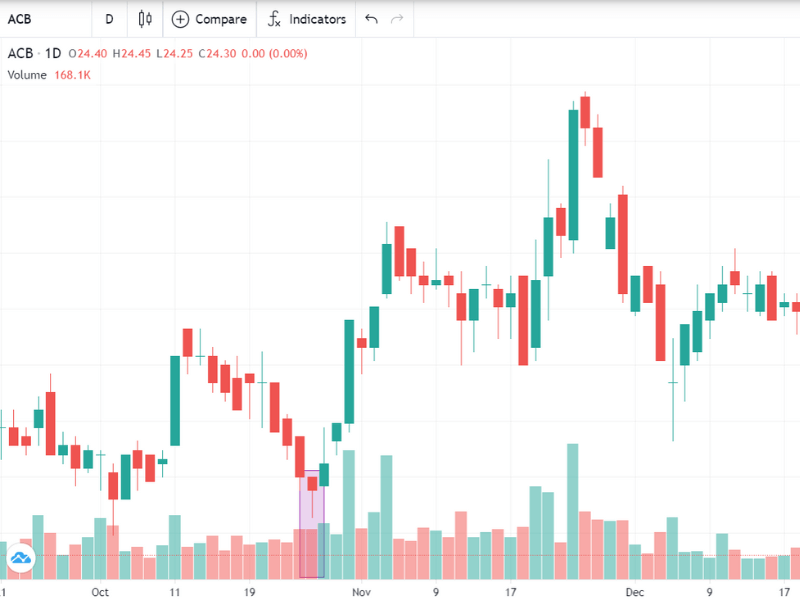 |
Hammer candlestick pattern on the ACB stock chart. Screenshot. |
Shooting star - a warning of a trend peak
This pattern is the opposite of the hammer, appearing after an uptrend and signaling a potential downward reversal. It has a small body, a long upper shadow, and a short or absent lower shadow. The shooting star reflects the failure of buyers to maintain upward momentum, creating an opportunity for early profit-taking.
If a red candle confirms the shooting star, investors should consider selling to secure profits.
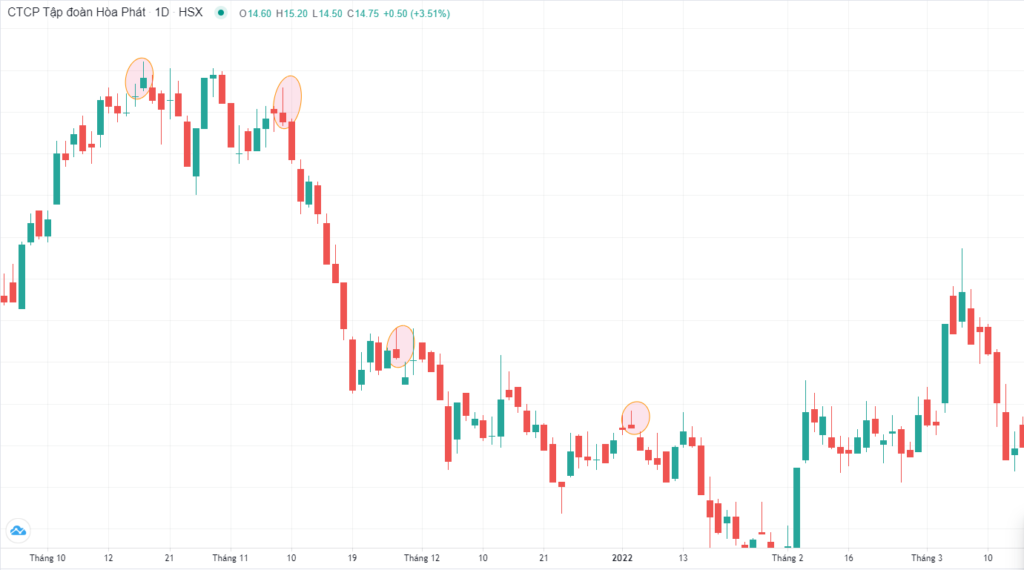 |
Shooting Star candlestick pattern. Screenshot. |
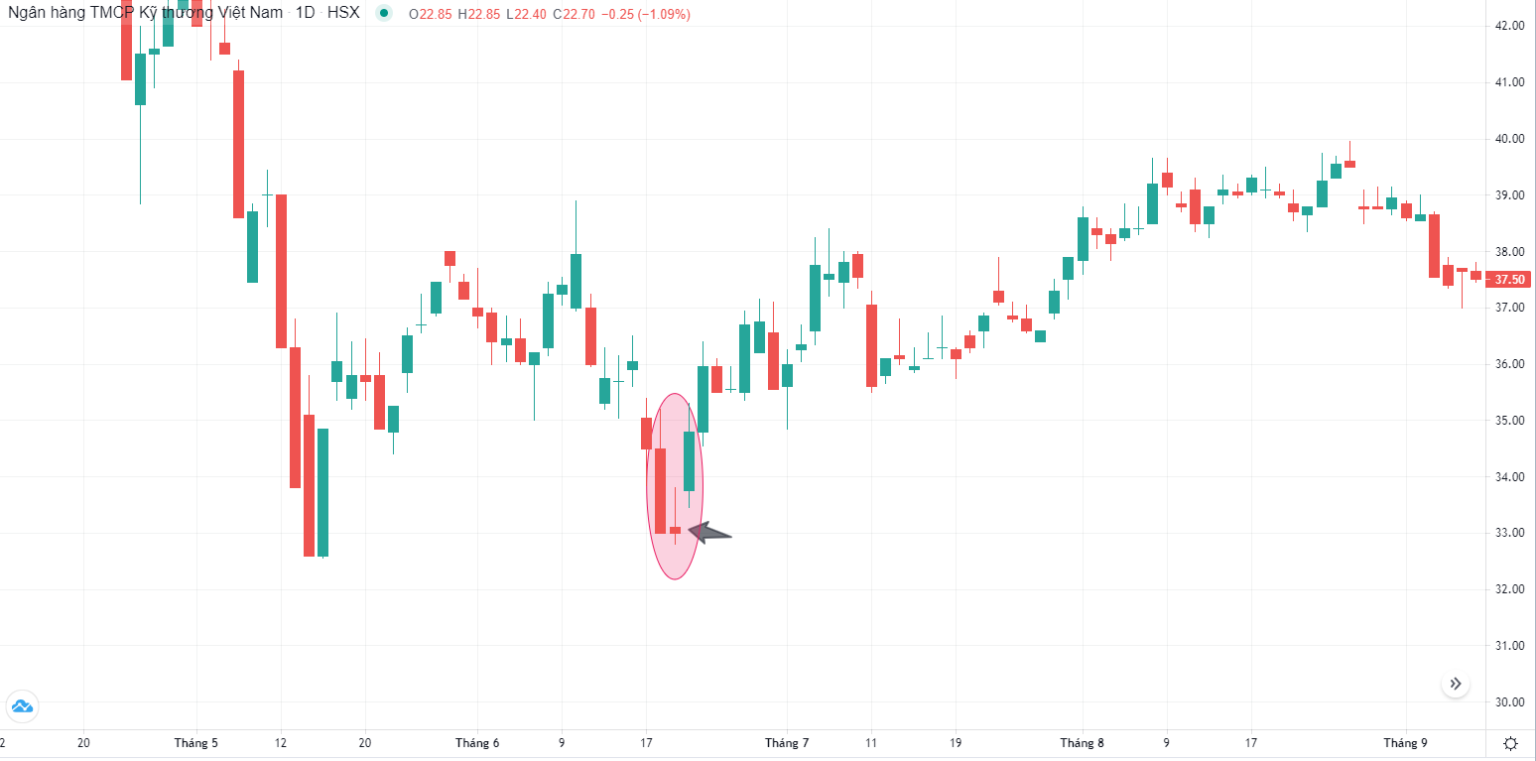
Bullish engulfing - recovery after a decline
The bullish engulfing pattern consists of two candlesticks: the first is a red candle, and the second is a longer green candle that completely "engulfs" the previous one. This pattern indicates that buyers have regained control after a period of selling pressure.
The reversal signal is stronger when it appears in a support zone or after a sharp decline.
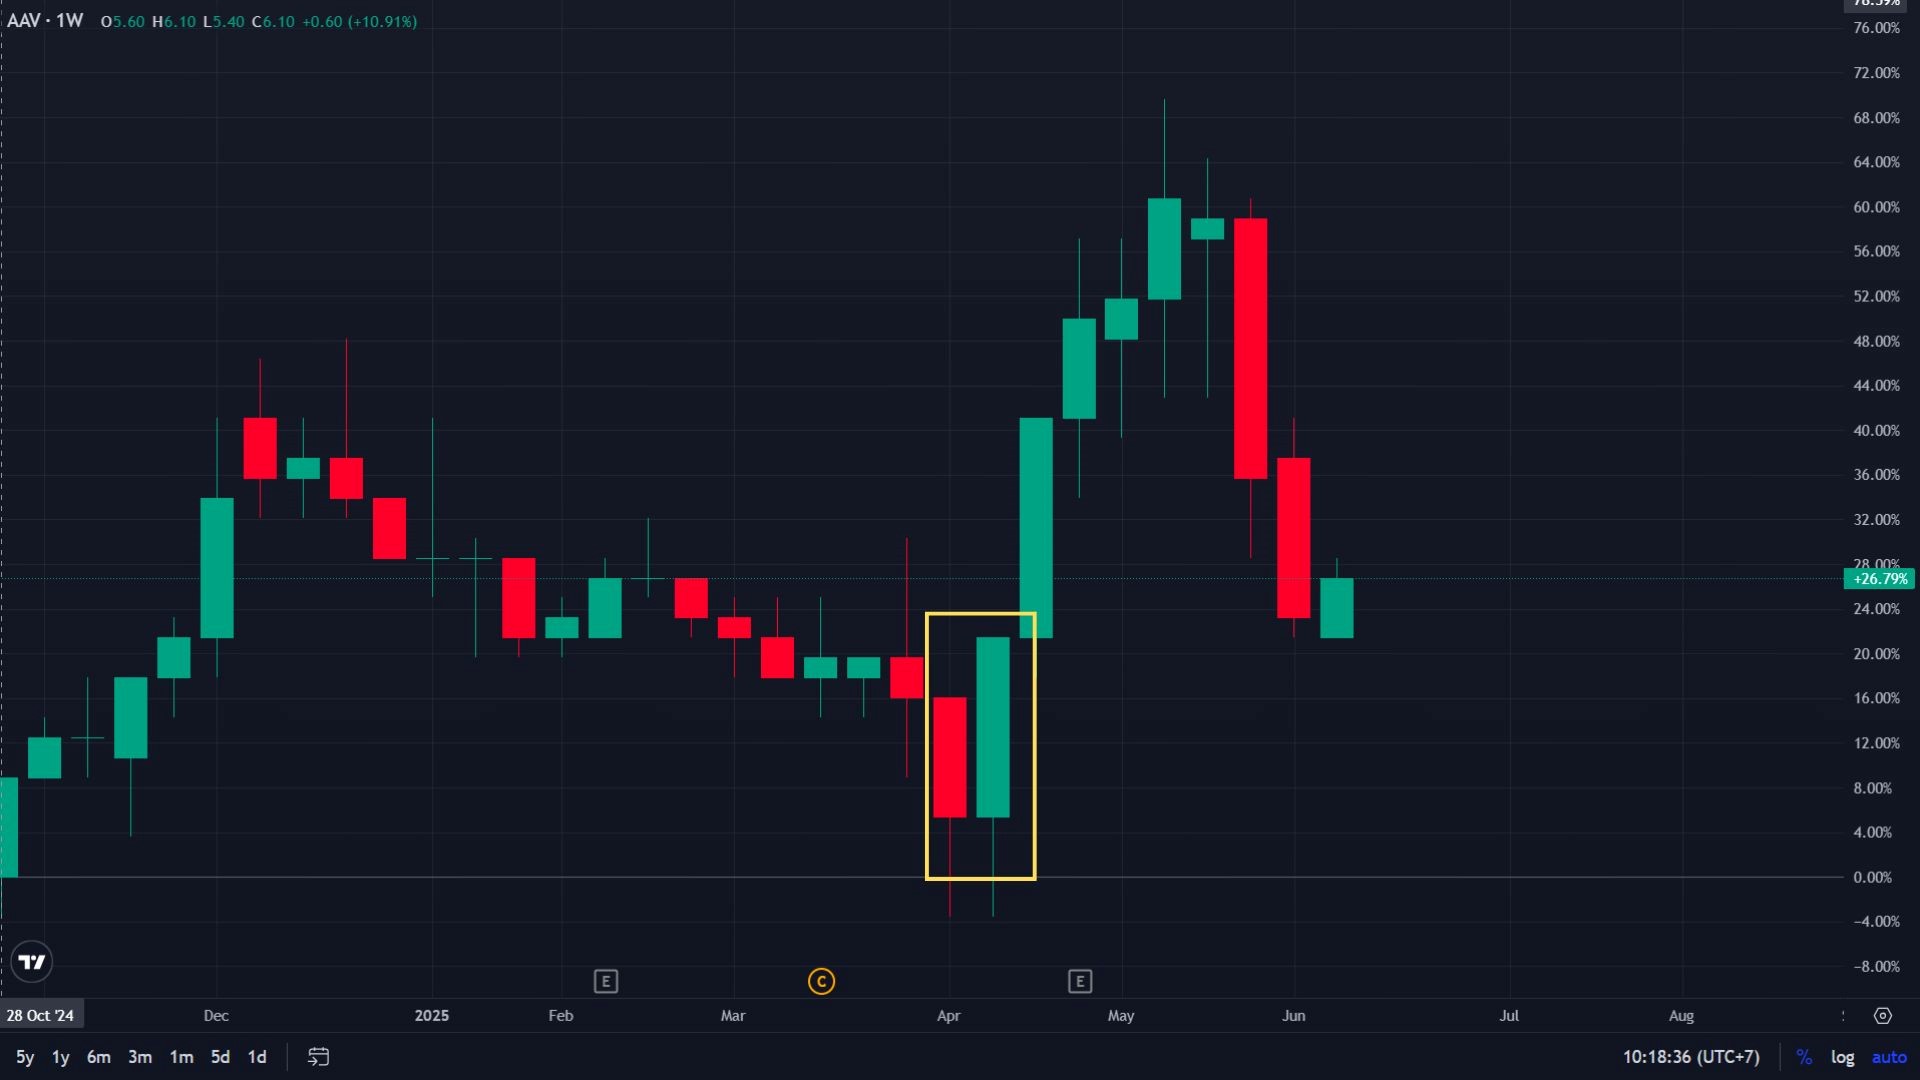 |
Bullish engulfing candlestick pattern on the AAV stock chart. Screenshot. |
Bearish engulfing - reversal after a rise
This is the reverse of the bullish engulfing pattern. The first candle is green, followed by a larger red candle that completely covers the previous one. This pattern often appears at peak areas, indicating a strong return of selling pressure.
For new investors, the bearish engulfing pattern is a clear sign to consider taking profits or avoiding buying at the top.
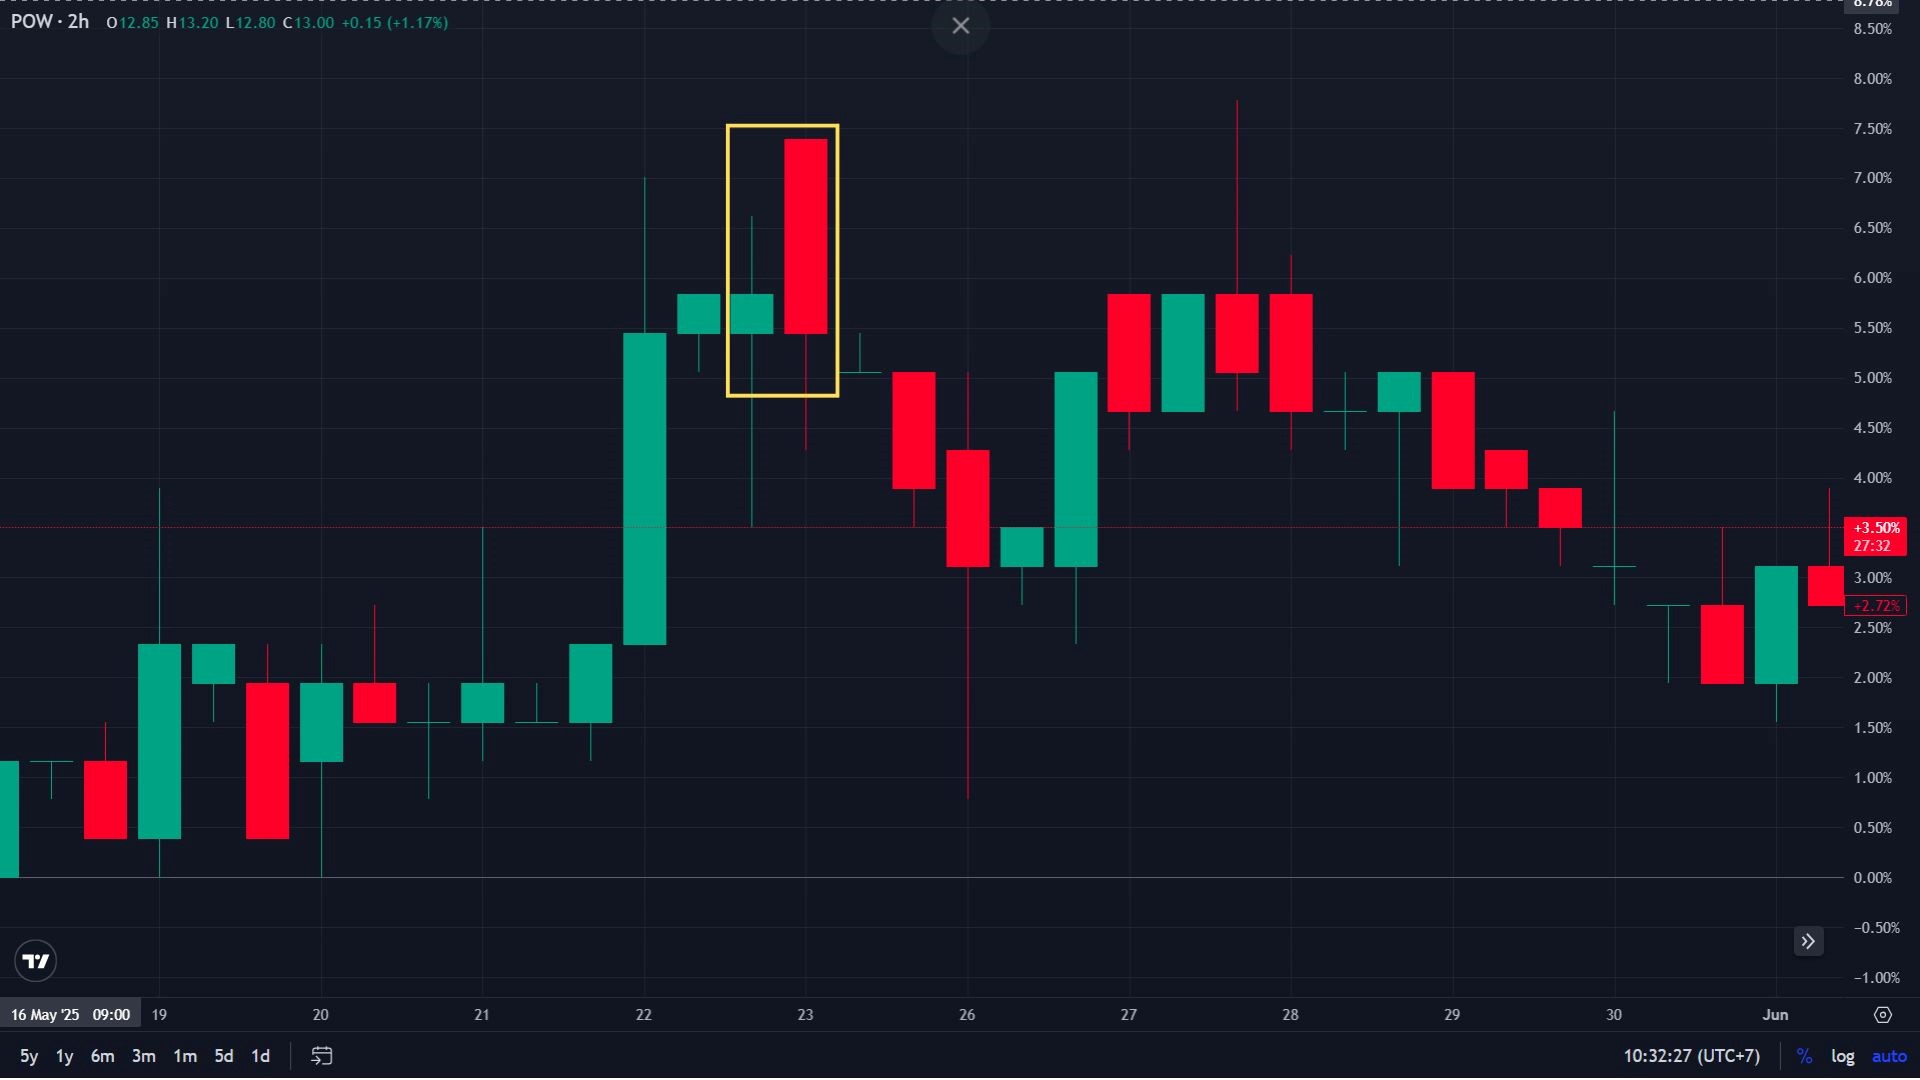 |
Bearish engulfing candlestick pattern on the POW stock chart. Screenshot. |
Morning star - the beginning of an uptrend
This pattern consists of three candlesticks: a long red candle, a small middle candle (doji or spinning top) showing hesitation, and a long green candle confirming the bullish reversal. The morning star reflects the transfer of control from sellers to buyers, helping investors identify early entry points.
The pattern is more effective when the third candle breaks through a resistance level or has high trading volume.
 |
Morning Star candlestick pattern. Screenshot. |
Evening star - a strong bearish reversal signal
The evening star is symmetrical to the morning star but in a bearish direction. It also consists of three candlesticks: a long green candle, followed by a small candle, and finally a long red candle. This is a strong signal that the uptrend has ended and sellers are gaining dominance.
For new investors, this pattern helps avoid falling into "false rise" traps and exiting positions at the right time.
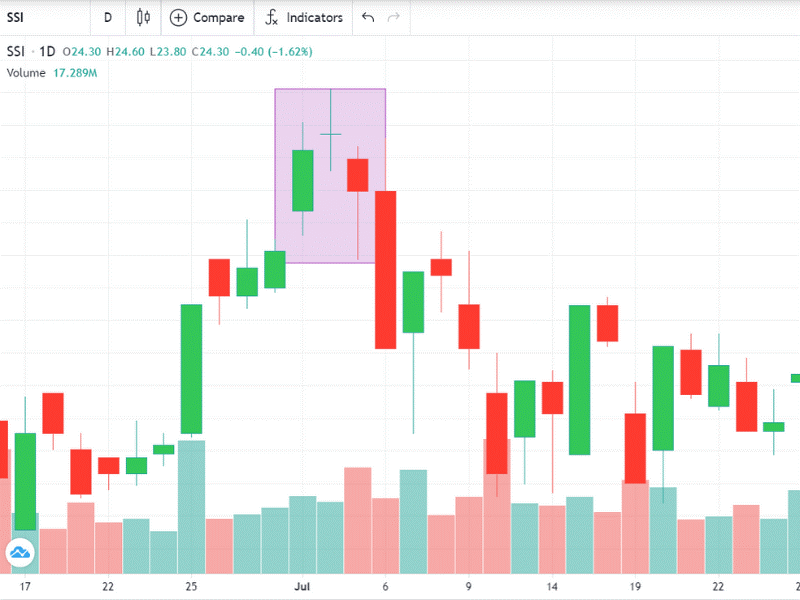 |
Evening Star candlestick pattern on the SSI stock chart. Screenshot. |
Important notes when trading with reversal candlestick patterns
First, investors should wait patiently for the pattern to complete and avoid entering positions prematurely before the candlestick closes. Some patterns require a confirmation candle to solidify the reversal trend. Trading too early can lead to misjudgment.
Second, set a reasonable stop-loss, just above the top or below the bottom of the pattern, about 2-3 pips away from the candlestick's shadow, to avoid noise. This is a mandatory step in any trading strategy.
Third, determine flexible profit targets based on support and resistance levels or apply common risk/reward ratios like 1:1 or 1:2. If the price moves as expected, investors can use a trailing stop to increase profits.
Additionally, investors should combine other technical analysis tools such as trading volume, RSI indicator, MACD line, trendlines, or head and shoulders patterns, double top patterns, double bottom patterns, etc., to confirm the reversal trend.
For new investors, reading charts or following candlestick patterns can be challenging initially. Some trading platforms like Entrade X by DNSE have built-in tools for identifying technical patterns, visualizing charts, and providing real-time data, along with investment ideas, making it easier for users to determine entry and exit points, even without much experience.
Candlestick patterns are not a perfect tool, but for new investors, they are a starting point for understanding market sentiment and improving trading skills. By mastering these 6 basic patterns, investors will gain more confidence in their decision-making and risk management.
Minh Dang