Vietnam's stock market continued its upward trend in the second quarter, repeatedly reaching new highs. At the close of trading on 7/8, the VN-Index hit a new peak of 1,588 points, the highest in history. The previous trading session on 5/8 saw record liquidity with 72,841 billion VND matched on the HoSE, bringing the total market liquidity to 82,563 billion VND. The rally since the beginning of QII has pushed many leading stocks in banking, securities, and real estate close to or exceeding their short-term peaks.
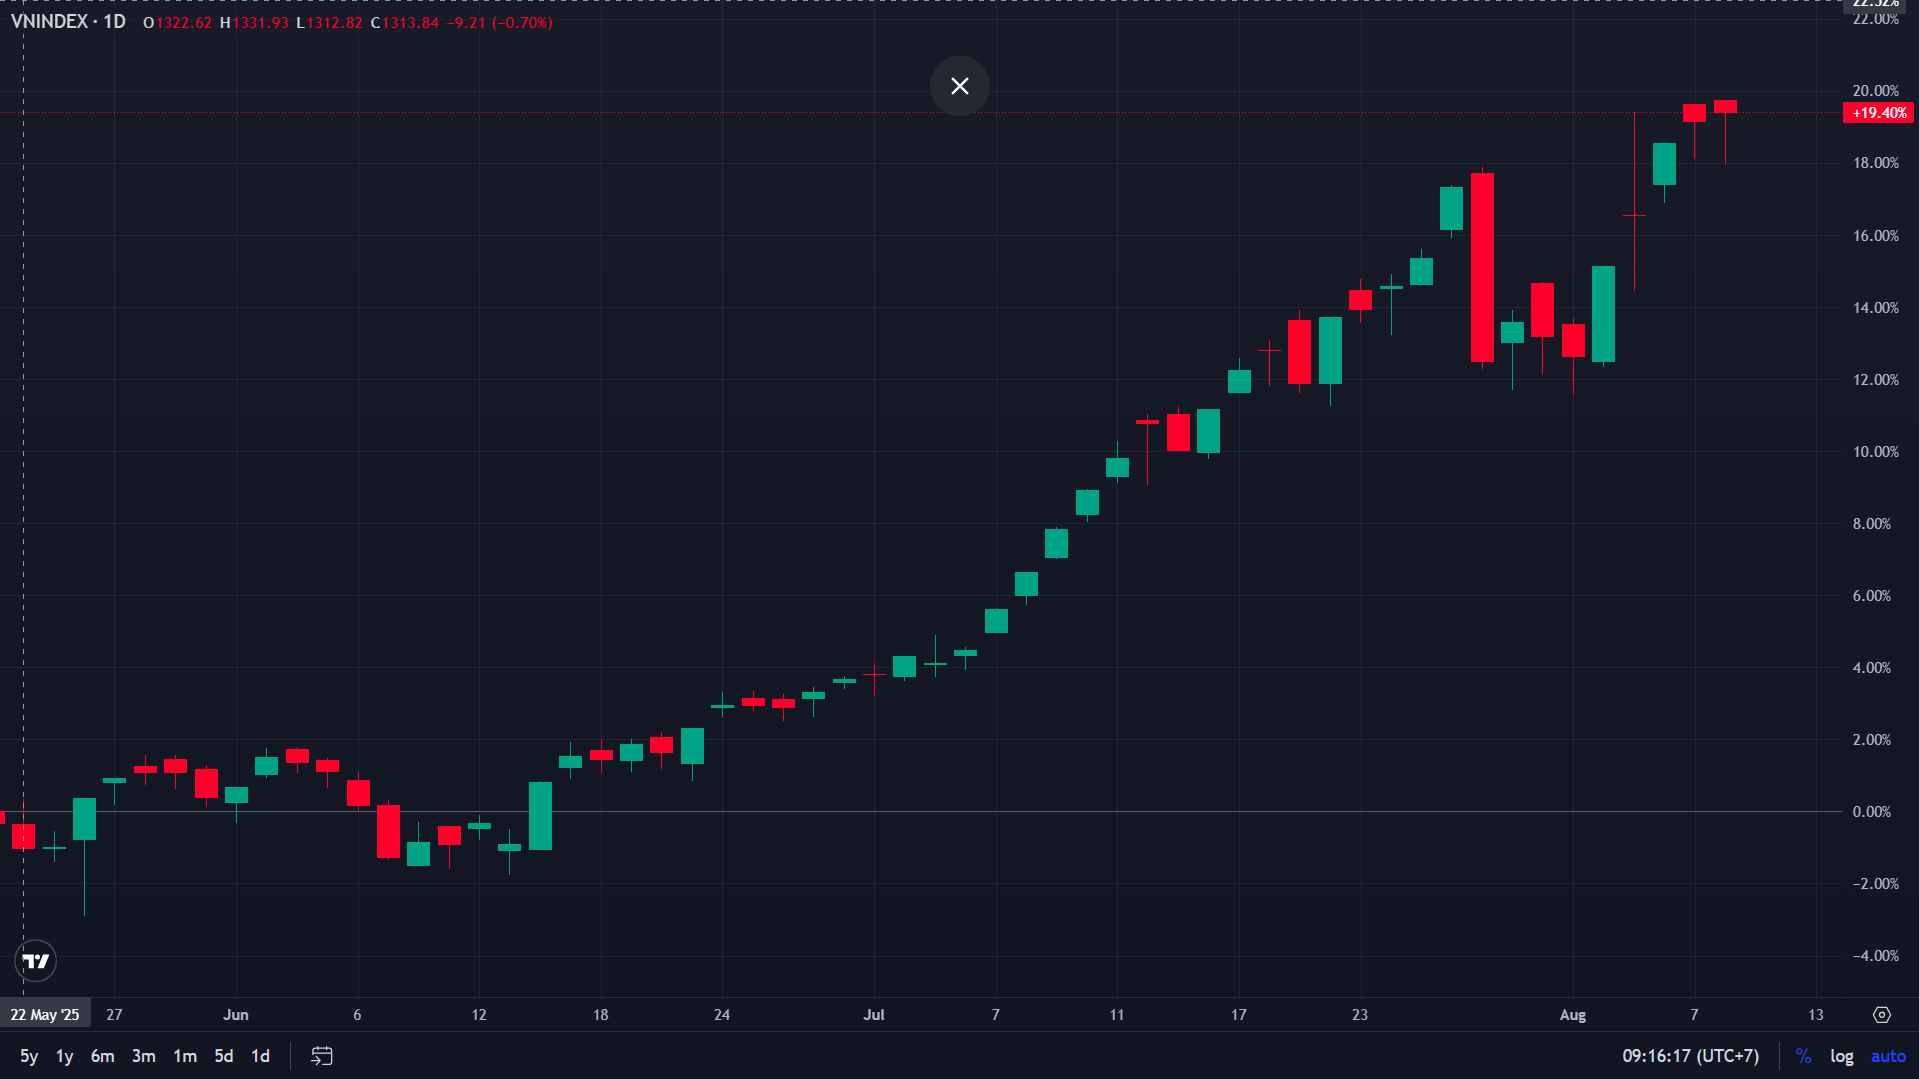 |
The VN-Index has been continuously rising in QII. Screenshot |
The VN-Index has been continuously rising in QII. Screenshot
While many institutions remain optimistic about the medium and long-term trends, numerous investors, especially newcomers, have started reducing their holdings to secure their gains after this rapid growth period. However, determining the right time to exit a position is challenging, particularly in a volatile market heavily influenced by crowd psychology.
Here are three technical tools analysts recommend for identifying profit-taking points:
Price Action
This method involves directly observing price movements on Japanese candlestick charts, independent of calculated indicators. When a stock approaches a peak and reversal candlestick patterns like shooting stars (small bodies, long upper wicks), bearish engulfing, or pin bars appear, accompanied by a surge in trading volume, it often signals increasing selling pressure and weakening upward momentum.
According to experts, price action allows investors to react faster than traditional technical indicators, especially in a euphoric market. Reading price action combined with trading volume analysis helps improve the probability of making timely decisions.
Many trading platforms now integrate Japanese candlestick charts with automatic pattern recognition, making it easier for investors to observe and detect technical signals without manual analysis.
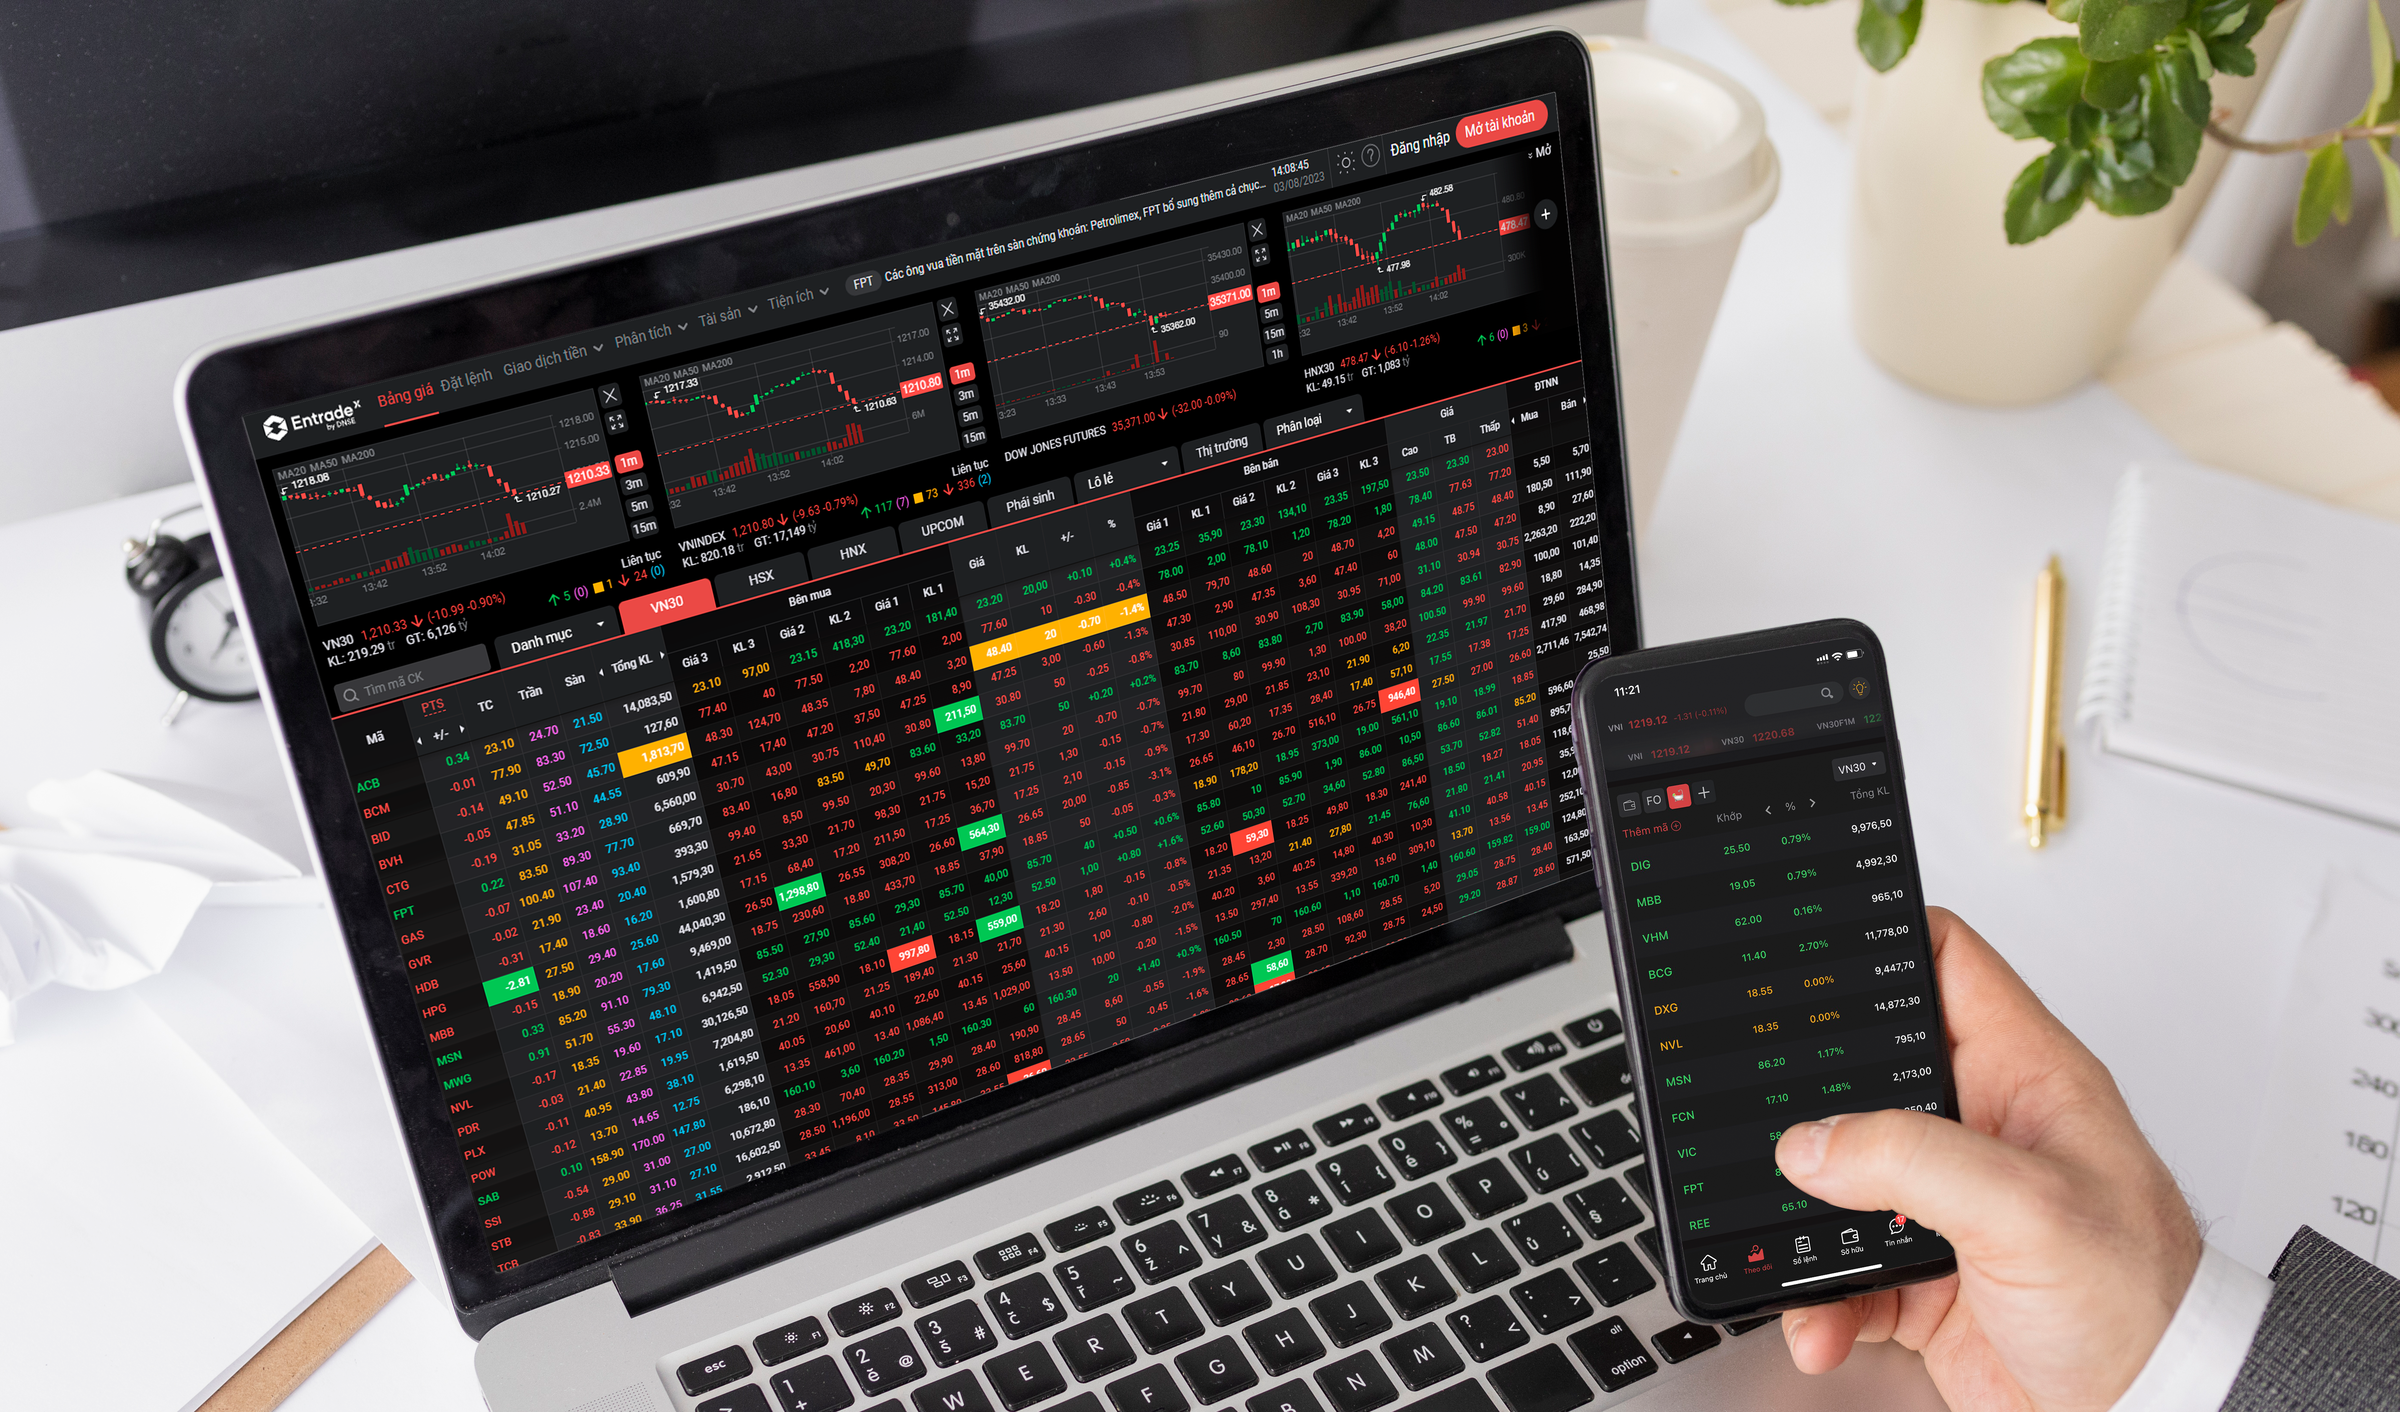 |
Investors can easily monitor market conditions on the Entrade X application. Photo: DNSE |
Investors can easily monitor market conditions on the Entrade X application. Photo: DNSE
Technical Indicators
Besides observing candlestick charts, investors can use integrated tools in trading software such as RSI, MACD, or Bollinger Bands. These indicators help identify when a stock is overbought, meaning it has risen too rapidly in a short period, or to spot signs of weakening trends.
Specifically, an RSI exceeding 70 points often reflects an overbought condition; an MACD crossing below the signal line at a high level indicates weakening cash flow; and with Bollinger Bands, when the price repeatedly touches the upper band and then reverses, investors might consider reducing their holdings. These indicators have a certain lag, but when combined with price action and trading volume, they increase the reliability of exit decisions.
"Technical indicators should not be used in isolation, but can serve as confirmation signals if price action has already provided a warning," a DNSE expert emphasized.
Most trading platforms now integrate these common technical indicators on user-friendly interfaces, enabling investors, including newcomers, to set custom alert criteria for their portfolios, actively monitor fluctuations, and make timely profit-taking or stop-loss decisions.
Resistance Levels
Resistance is a price level where past selling pressure caused the market to reverse. When the price returns to this level after a period of increase, it often brings caution from investors, especially those who have already accumulated profits.
Currently, the VN-Index is fluctuating around 1,574 points, far exceeding the previous peak set in 2022. Many leading stocks are also approaching their historical highs. This is a crucial technical signal to consider gradually reducing holdings, particularly for stocks that have risen rapidly in a short time.
Instead of selling all their shares, experts recommend investors develop a partial selling strategy, prioritizing reducing holdings in stocks that have hit technical warning thresholds. This approach helps optimize profits if the market has further upside potential.
Deciding when to take profits is often difficult and easily influenced by emotions. Using tools like price action, technical indicators, and identifying resistance levels helps investors make objective decisions, minimizing risk.
 |
DNSE's virtual stock assistant, Ensa, supports analysis, information synthesis, and business evaluation 24/7. Photo: DNSE |
DNSE's virtual stock assistant, Ensa, supports analysis, information synthesis, and business evaluation 24/7. Photo: DNSE
With today's technology, investors have more tools to consult during trading. For example, DNSE Securities' platform integrates AI tools like the virtual stock assistant, Ensa, and products like Investment Ideas, providing recommendations, insights, and technical analysis to help investors make informed and timely decisions.
DNSE recently pioneered the launch of the AI Order feature, an automated order placement solution using artificial intelligence to optimize trading prices for large-volume orders, reducing manual operations and enhancing investment efficiency. This is the first time in Vietnam that a securities company has integrated AI directly into the order placement process, marking a new step in personalized investment experiences.
According to experts, preserving investment gains is the top priority in the current phase. Investors shouldn't try to predict market peaks, but instead act strategically based on technical data and reasonable profit expectations.
Minh Dang