The "dark cloud cover" is a Japanese candlestick pattern that typically appears at the end of an uptrend. Technical analysts consider it an early warning sign of a potential price reversal. The pattern consists of two consecutive candlesticks: the first is a long green candle, showing strong buying pressure; the next is a red candle, opening higher but closing below the midpoint of the previous green candle's body. This indicates selling pressure has returned, pushing the price down significantly compared to previous expectations.
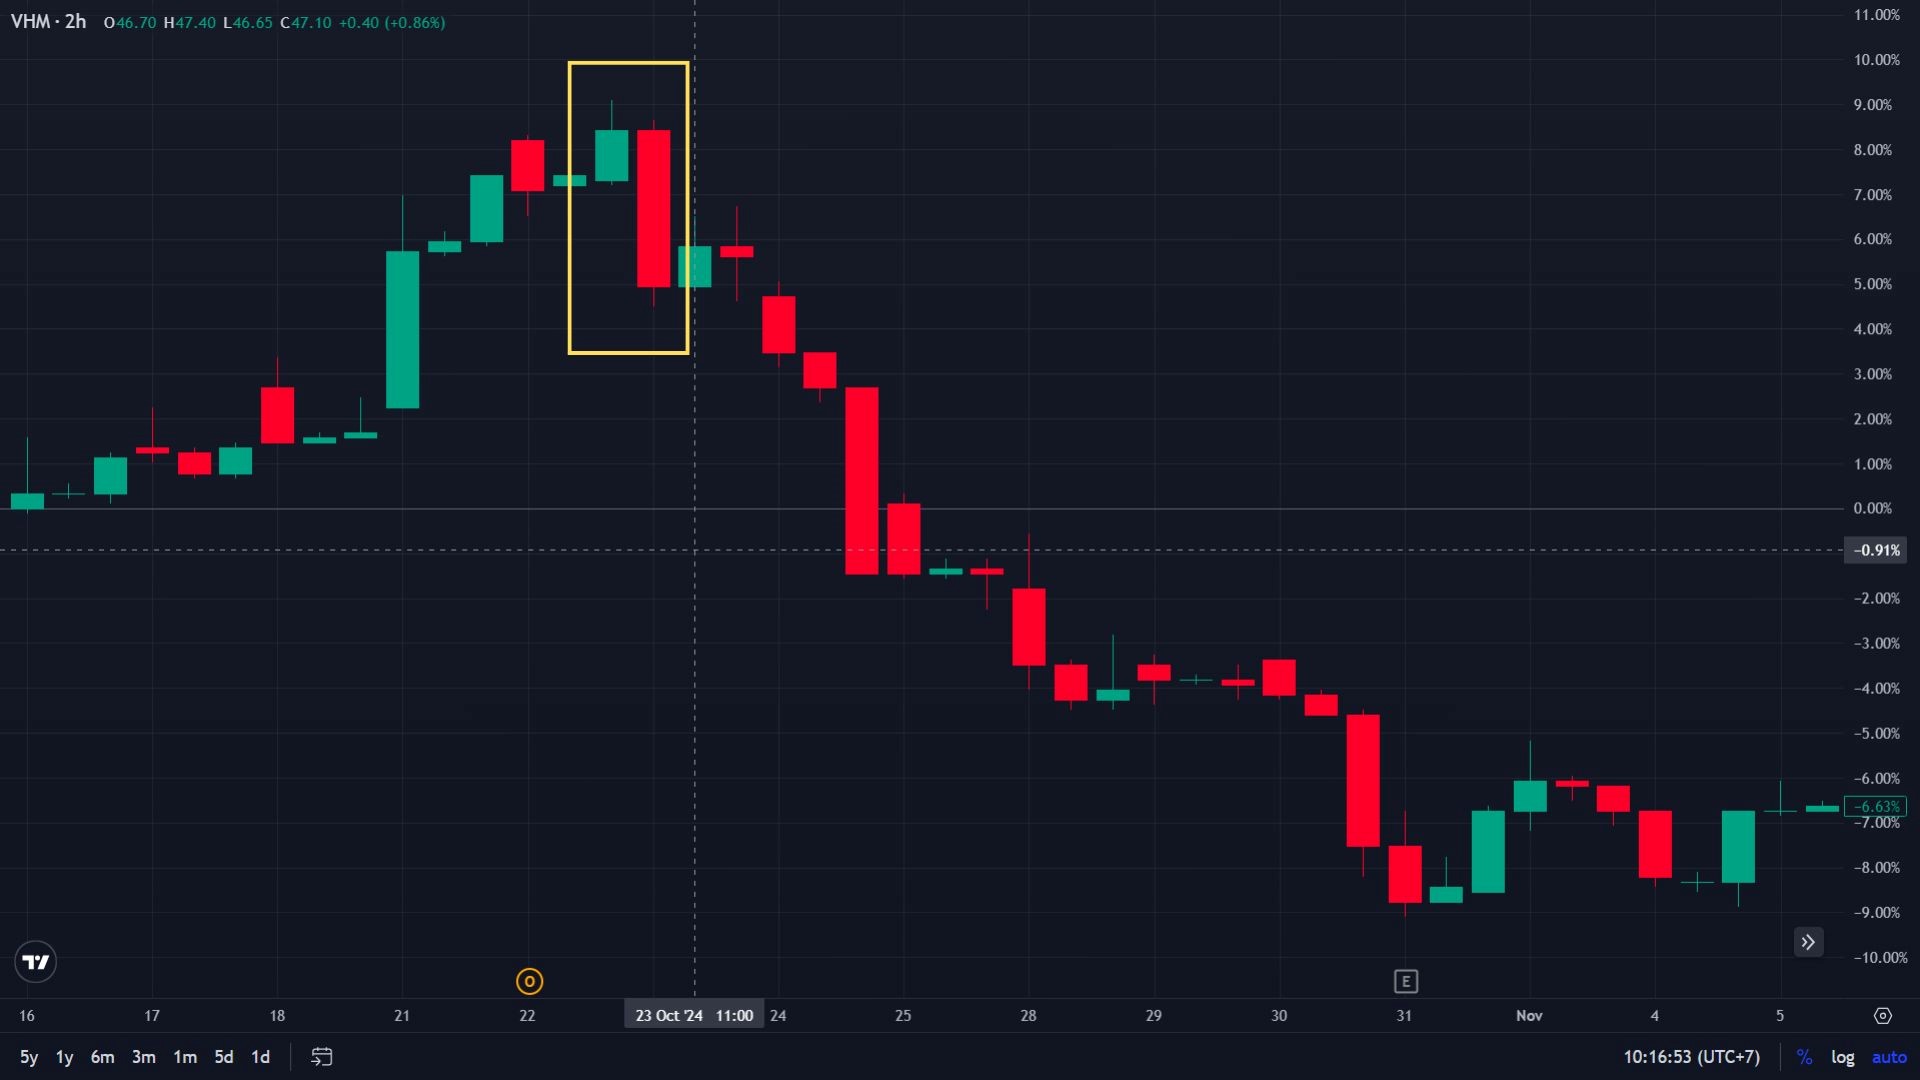 |
The "dark cloud cover" candlestick pattern appearing in the VHM stock price chart. Photo: DNSE |
The "dark cloud cover" candlestick pattern appearing in the VHM stock price chart. Photo: DNSE
According to DNSE experts, this pattern often reflects a shift in market sentiment. When the price opens optimistically but closes lower, investors begin to doubt the upward momentum and tend to become defensive. Profit-taking pressure also often increases after rapid price increases, making the market prone to short-term corrections during the red candlestick.
Accurately identifying the pattern is crucial. Experts suggest the "dark cloud cover" should be seen as an early warning, not an absolute basis for trading decisions. The pattern is only truly reliable when it appears after a clear uptrend, especially in an overbought market or near strong resistance levels. If it forms during a sideways trend or when the market lacks momentum, the signal can be misleading and may not accurately reflect the trend.
The shape of the candlesticks plays an important role in establishing the pattern. The second, red candlestick needs a long body and must close below at least 50% of the previous green candlestick's body to clearly show dominant selling pressure. If the candle has a long shadow, the pattern's confirmation weakens as it reflects market indecision.
In addition to candlestick shape, trading volume is also a key supporting factor. The pattern becomes more reliable if the down session is accompanied by a surge in volume, reflecting significant selling pressure from investors.
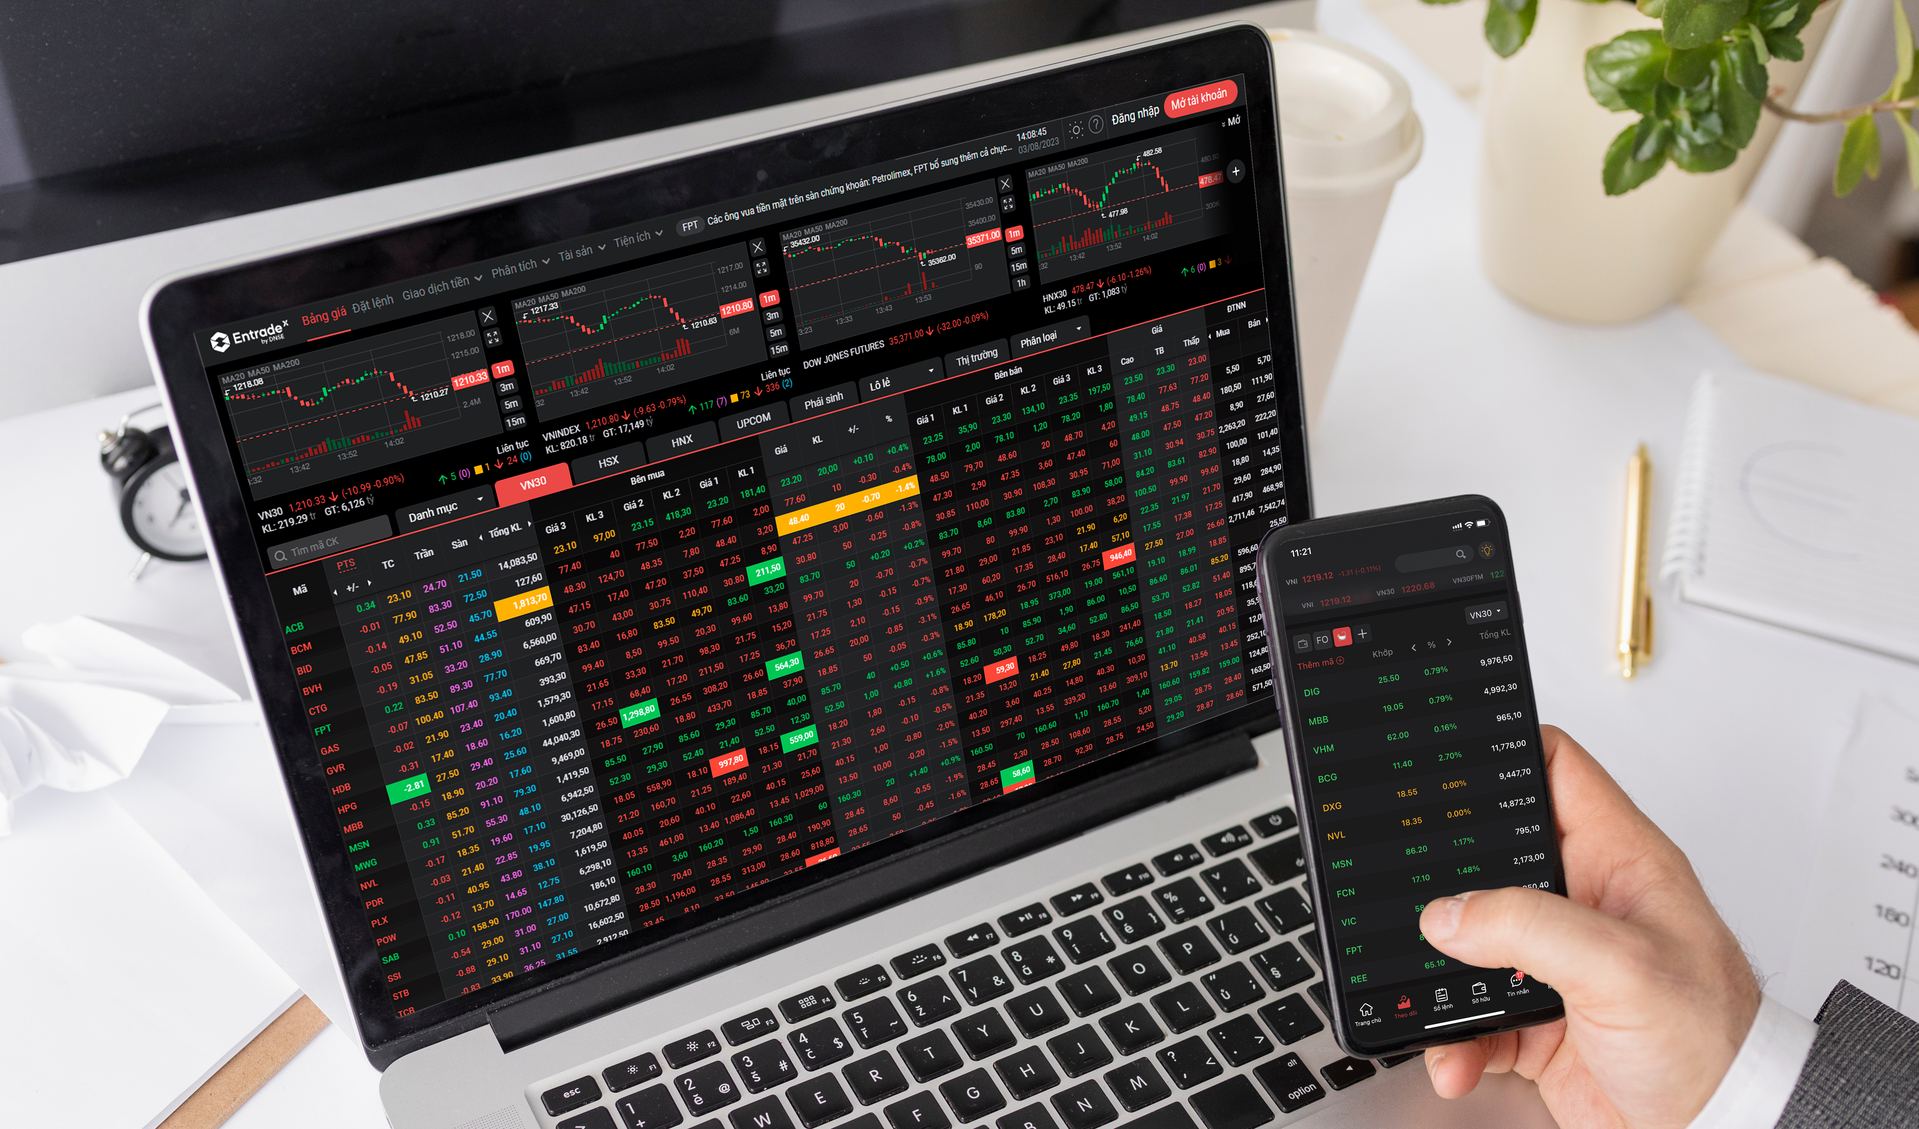 |
DNSE provides a trading platform with technical indicators and market information to support investors. Photo: DNSE |
DNSE provides a trading platform with technical indicators and market information to support investors. Photo: DNSE
DNSE experts recommend combining the "dark cloud cover" with other technical indicators for greater accuracy in trend assessment. If the RSI exceeds 70, indicating an overbought market, or if the MACD starts to show negative divergence, the likelihood of a reversal increases. Conversely, without clear supporting signals, the pattern may only reflect temporary volatility rather than a true correction.
Many individual investors, especially newcomers, often overreact to this pattern, hastily selling stocks out of fear of a market decline. However, experts advise against acting on a single signal without market confirmation. Investors should observe market developments over the next one or two sessions to verify the pattern's accuracy.
For those holding stocks with substantial gains, the "dark cloud cover" can be an opportunity to consider taking partial profits or adjusting stop-loss points to protect gains. Meanwhile, for those considering opening new positions, it's a time to pause, observe further, and act only when there are clearer confirming signals.
The "dark cloud cover" is not a perfect predictive tool, but if applied correctly and in the right context, it can help investors identify risks early and respond appropriately. In volatile markets, maintaining discipline and assessing the context accurately is as crucial as seeking profits.
Minh Ngoc
To foster a connected investor community, DNSE Securities is currently hosting the "2025 Stock Market Olympics" with two competing categories: Derivatives Surfing and Stock Marathon. The total prize pool is nearly 640 million dong.
Investors can learn more about the rules and registration process here.